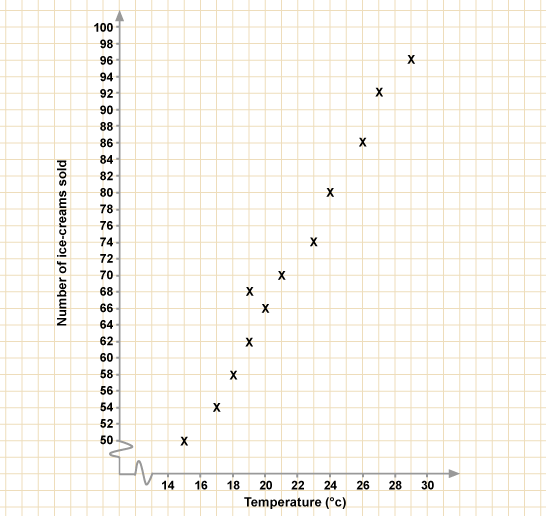
Scatter diagrams are a way of showing information and to plot number data. There are 3 correlation's : postive, negative and no.
Positive Correlation - crosses from the bottom left to the top right.
Negative Correlation - crosses from the top left to the bottom right.
No Correlation - random crosses showing no pattern.
Question 1 ~ If you had a table like below. You would go along the bottom for the x axis, then up the stairs for the y axis. Once you have done that you will plot your cross. Have a go at doing this, it should be a negative correlation! For the line of best fit, you draw a line using a ruler going through as many crosses as you can. The line of best fit gives you the relationship between the crosses.
|
X
3 8 5 1 6 2 |
Y
6 2 4 7 3 6 |
